What is Zabbix?
Zabbix monitoring system
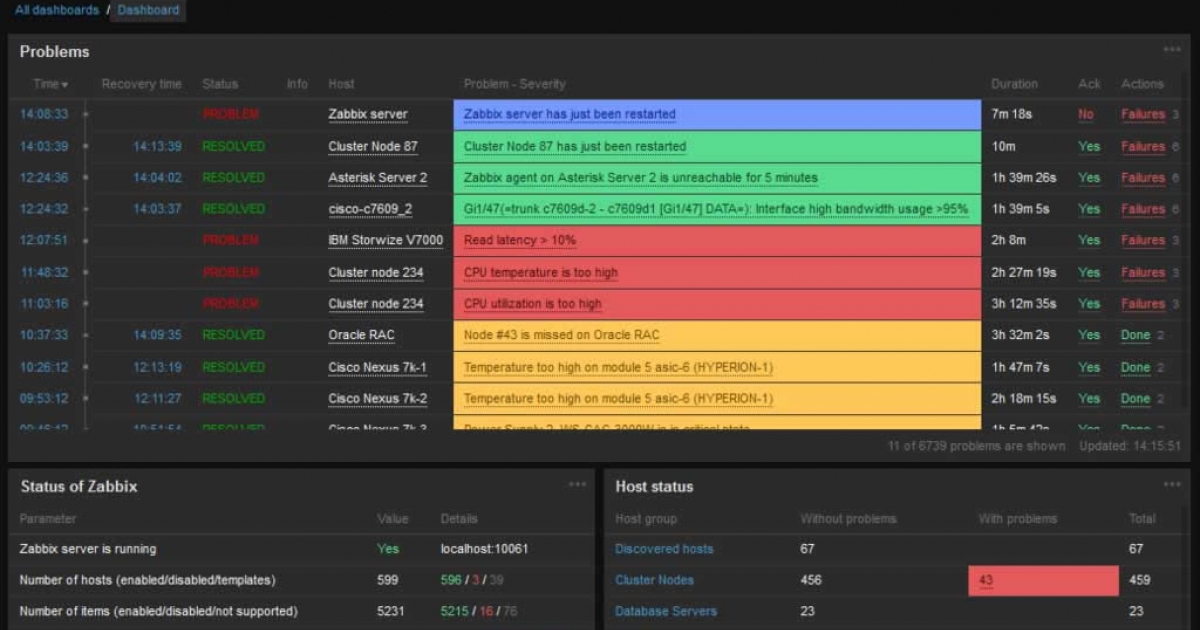
Zabbix is an open source monitoring tool for various IT components, including networks, servers, virtual machines (VMs), and cloud services. Zabbix provides monitoring metrics such as: network utilization, CPU load, and disk space consumption. Zabbix monitoring configuration can be done using XML-based templates that contain elements to monitor. Software that monitors operations on Linux, Hewlett Packard Unix (HP-UX), Mac OS X, Solaris, and other operating systems (OS), Windows monitoring is only possible through agents. Zabbix can use MySQL, MariaDB, PostgreSQL, SQLite, Oracle or IBM DB2 to store data. Zabbix is written in C code and the web interface is written in PHP. Zabbix offers several monitoring options:
Simple checks can verify the availability and responsiveness of standard services like SMTP or HTTP without installing any software on the monitored host.
A Zabbix agent can also be installed on UNIX and Windows hosts to monitor statistics like CPU load, network utilization, disk space, etc.
As an alternative to installing an agent on hosts, Zabbix includes support for monitoring through SNMP, TCP, and ICMP checks, as well as through IPMI, JMX, SSH, Telnet, and the use of custom parameters. Zabbix supports a variety of near real-time notification mechanisms, including XMPP.
Feature
High performance and capacity by being able to monitor hundreds of thousands of devices.
Automated discovery of servers and network interface devices. Low-level detection, automatically begins to monitor new elements of the file system or network interfaces between other devices.
Distributed monitoring with centralized web administration.
High-performance native agents (client software for Linux, Solaris, HP-UX, AIX, FreeBSD, OpenBSD, OS X, Tru64 / OSF1, Windows 2000, Windows Server 2003, Windows XP, Windows Vista, Windows Server 2008, Windows 7 )
SLA and ITIL KPI metrics in reports.
High-level (commercial) view of resources monitored through user-defined visual console screens and panels.
Remote command execution through Zabbix proxy servers from August 2017, up to Zabbix 3.4
Architecture
- Agent or agentless monitoring capabilities.
- Web based interface.
- Support for polling and capture mechanisms.
Supervision
- JMX monitoring.
- Web monitoring.
Security and authentication
- Audit log.
- Secure user authentication.
- Flexible user permissions.
- Notification capabilities
Flexible email notification of predefined events.
Notification mechanisms more than 99% in real time, for example, using the included XMPP protocol.