Google PageSpeed Insights

PageSpeed Insights (PSI) it informs about the performance of a page on mobile and desktop devices and also provides suggestions on how that page can be improved. Providing detailed information on the main points that affect the loading performance of our website.
This tool could be an essential ally that will help us optimize our website with which we could correct points such as:
Loading speed of our website.
Size and loading performance of an image.
Size and loading performance of a CSS….
In addition to other essential data to obtain the best loading performance of our website.
PSI provides laboratory and field data on a page. Laboratory data is useful for debugging performance problems, since they are collected in a controlled environment. However, you may not capture real-world bottlenecks. Field data is useful for capturing the real user experience in the real world but they have a more limited set of metrics.
Performance score
At the top of the report, PSI provides a score that summarizes the performance of the page. This score is determined by running Lighthouse to collect and analyze laboratory data on the page. A score of 90 or more is considered fast and 50 to 90 is considered moderate. Below 50 is considered slow.
Real World Field Data
When PSI receives a URL, it will look for it in the Chrome User Experience Report (CrUX) data set. If available, PSI reports the First Paintful Contentful (FCP) and First Input Delay (FID) metric data for the source and potentially the specific URL of the page.
Fast, moderate, slow classification
PSI also classifies field data into 3 segments, describing experiences considered fast, moderate or slow. PSI sets the following thresholds for fast / moderate / slow, according to our analysis of the CrUX data set:
Fast Moderate Slow
FCP [1000 ms] (1000 ms, 3000 ms) more than 3000 ms
FID [0.100 ms] (100 ms, 300 ms) more than 300 ms
Distribution and selected value of FCP and FID
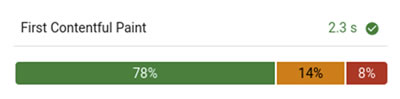
PSI presents a distribution of these metrics so that developers can understand the range of FCP and FID values for that page or source. This distribution is also divided into three categories: Fast, Moderate and Slow denoted with green, orange and red bars. For example, seeing 14% within the orange FCP bar indicates that 14% of all observed FCP values fall between 1,000ms and 3,000ms. This data represents an aggregate view of all page loads in the last 30 days.
Above the distribution bars, PSI reports on the 75th percentile First Contentful Paint and the 95th percentile First Input Delay, presented in seconds and milliseconds respectfully. These percentiles are selected so that developers can understand the most frustrating user experiences on their site. These field metric values are classified as fast / moderate / slow by applying the same thresholds shown above.
Field Data Summary Tag
A general label is calculated from the field metric values:
Fast: if FCP and FID are fast.
Slow: if any of the FCP or FID is slow.
Moderate: all other cases.
Differences between field data in PSI and CrUX
The difference between the field data in PSI and the Chrome User Experience Report in BigQuery is that the PSI data is updated daily during the 30-day period. The dataset in BigQuery is only updated monthly.
Laboratory data
PSI uses Lighthouse to analyze the given URL, generating a performance score that estimates the performance of the page in different metrics that include: First satisfactory paint, First significant paint, Speed index, First CPU inactivity, Interactivity time and Latency Estimated input
Each metric is scored and labeled with an icon:
Fast is indicated with a green check mark
Moderate is indicated with an informative orange circle
Slow is indicated by a red warning triangle.
If you have any questions, do not hesitate to contact the Picaraza Domains support team 24/7/365.


